
.svg)
.png)
%201.png)

Industry Insights
KYB Software for Payment Platforms: How to Choose the Right Solution
KYB software for payment platforms automates merchant verification using registries, sanctions lists, and ownership data. Compare top providers and features.
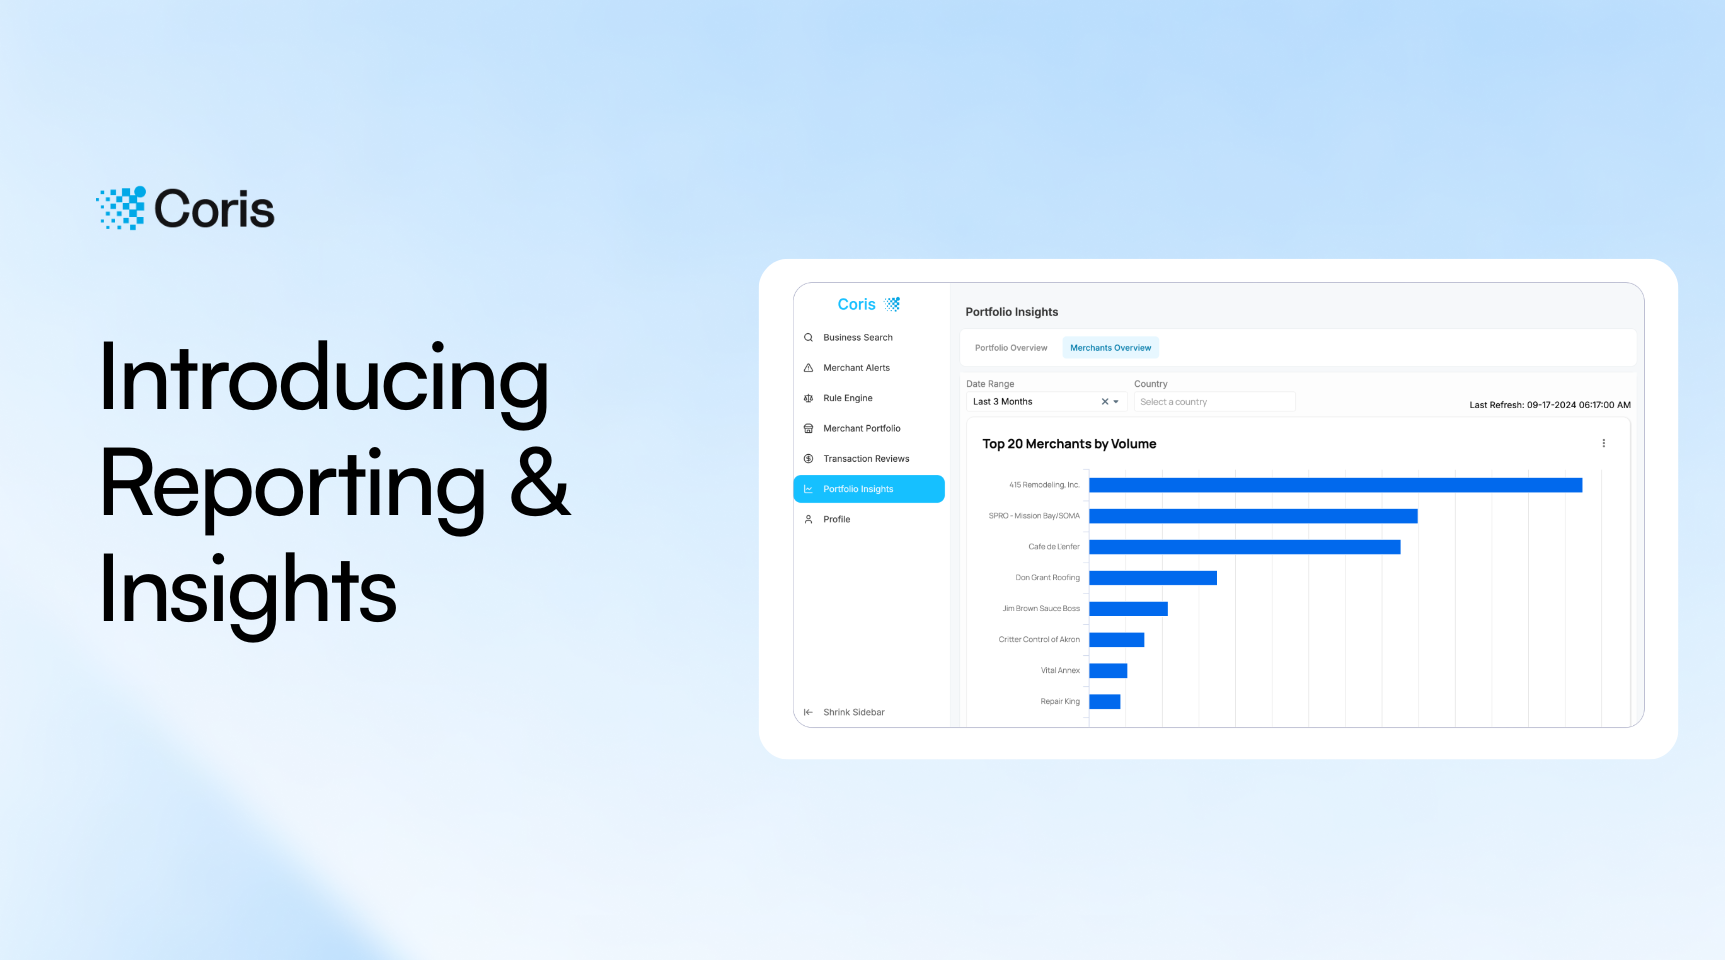
Coris launches a reporting and insights dashboard that consolidates portfolio, merchant, and team-level metrics—giving risk teams a single source of truth to improve decisioning and productivity.

Coris’s mission is to modernize risk infrastructure for software platforms serving SMBs. To achieve this mission, we’re constantly looking for ways to make risk teams’ workflows faster and more efficient.
Our new reporting and insights dashboard does just that. Now, risk teams can view custom insights on their entire merchant portfolio and internal team performance in one place.
Read on to learn more, or contact us to get started.
Typically, risk teams prepare reports using multiple tools: Stripe or Adyen for payments reporting, a CRM like Zendesk for team productivity reports, and Looker or Tableau for miscellaneous reports. This is an extremely manual process, and there is no easy way to aggregate insights across these reports to get a holistic view of portfolio performance.
Simply put, there is no authoritative system of record (SOR) consolidating merchant activity. As our customers shared their experiences of painful data silos and labor-intensive data gathering, we started iterating on our own solution to this problem.
Our reporting and insights dashboard enables better risk decisioning and enhances team productivity. It consolidates insights at the portfolio, merchant, and team level on a daily basis:
The risk & insights dashboard is available to all of our Platform customers.
We’re actively building out additional capabilities within our reporting & insights dashboard, such as a custom report builder.
Contact us if you’d like to learn more or request an additional reporting feature.

Follow us
.svg)

